2.35. MedeA P3C: Polymer Property Prediction Using Correlations
Contents
| download: | pdf |
|---|
2.35.1. Key Benefits of MedeA P3C
- Evaluation of diverse polymer properties based on topological information
- Rapid property calculation enabling screening of large numbers of potential polymers
- Ability to handle any desired polymer system (based on the elements: C, N, O, F, H, Si, S, Cl, and Br) with no reliance on group-based correlations
- Ability to handle designer correlations for particular polymer classes
2.35.2. Computational Characteristics
- Based on Bicerano’s Prediction of Polymer Properties, third edition
- Provides thermophysical, entanglement, mechanical, transport, and electronic properties
- Uses repeat unit topology combined with knowledge of head and tail atoms to compute properties based on correlations
2.35.3. Introduction
MedeA P3C: Polymer Property Prediction using Correlations employs correlations to predict polymer properties based on the chemical topology of constituent repeat units. The correlations on which P3C is based have been developed and described by Jozef Bicerano in ‘Prediction of Polymer Properties’ [1] and are the result of extensive research conducted at the Dow Chemical company.
2.35.4. Usage
Invoke MedeA P3C either interactively in Molecular Builder or automatically in the MedeA Flowcharts.
- Build a repeat unit following the steps outlined in the Molecular Builder section, or
- Retrieve a provided repeat unit from MD/Structures/RepeatUnits via File >> Open structure from disk
Interactively:
Hover your mouse to the upper right corner of the active structure window, click on the Select side panel icon (
 ), and choose Molecular builder. This opens the Molecular Builder
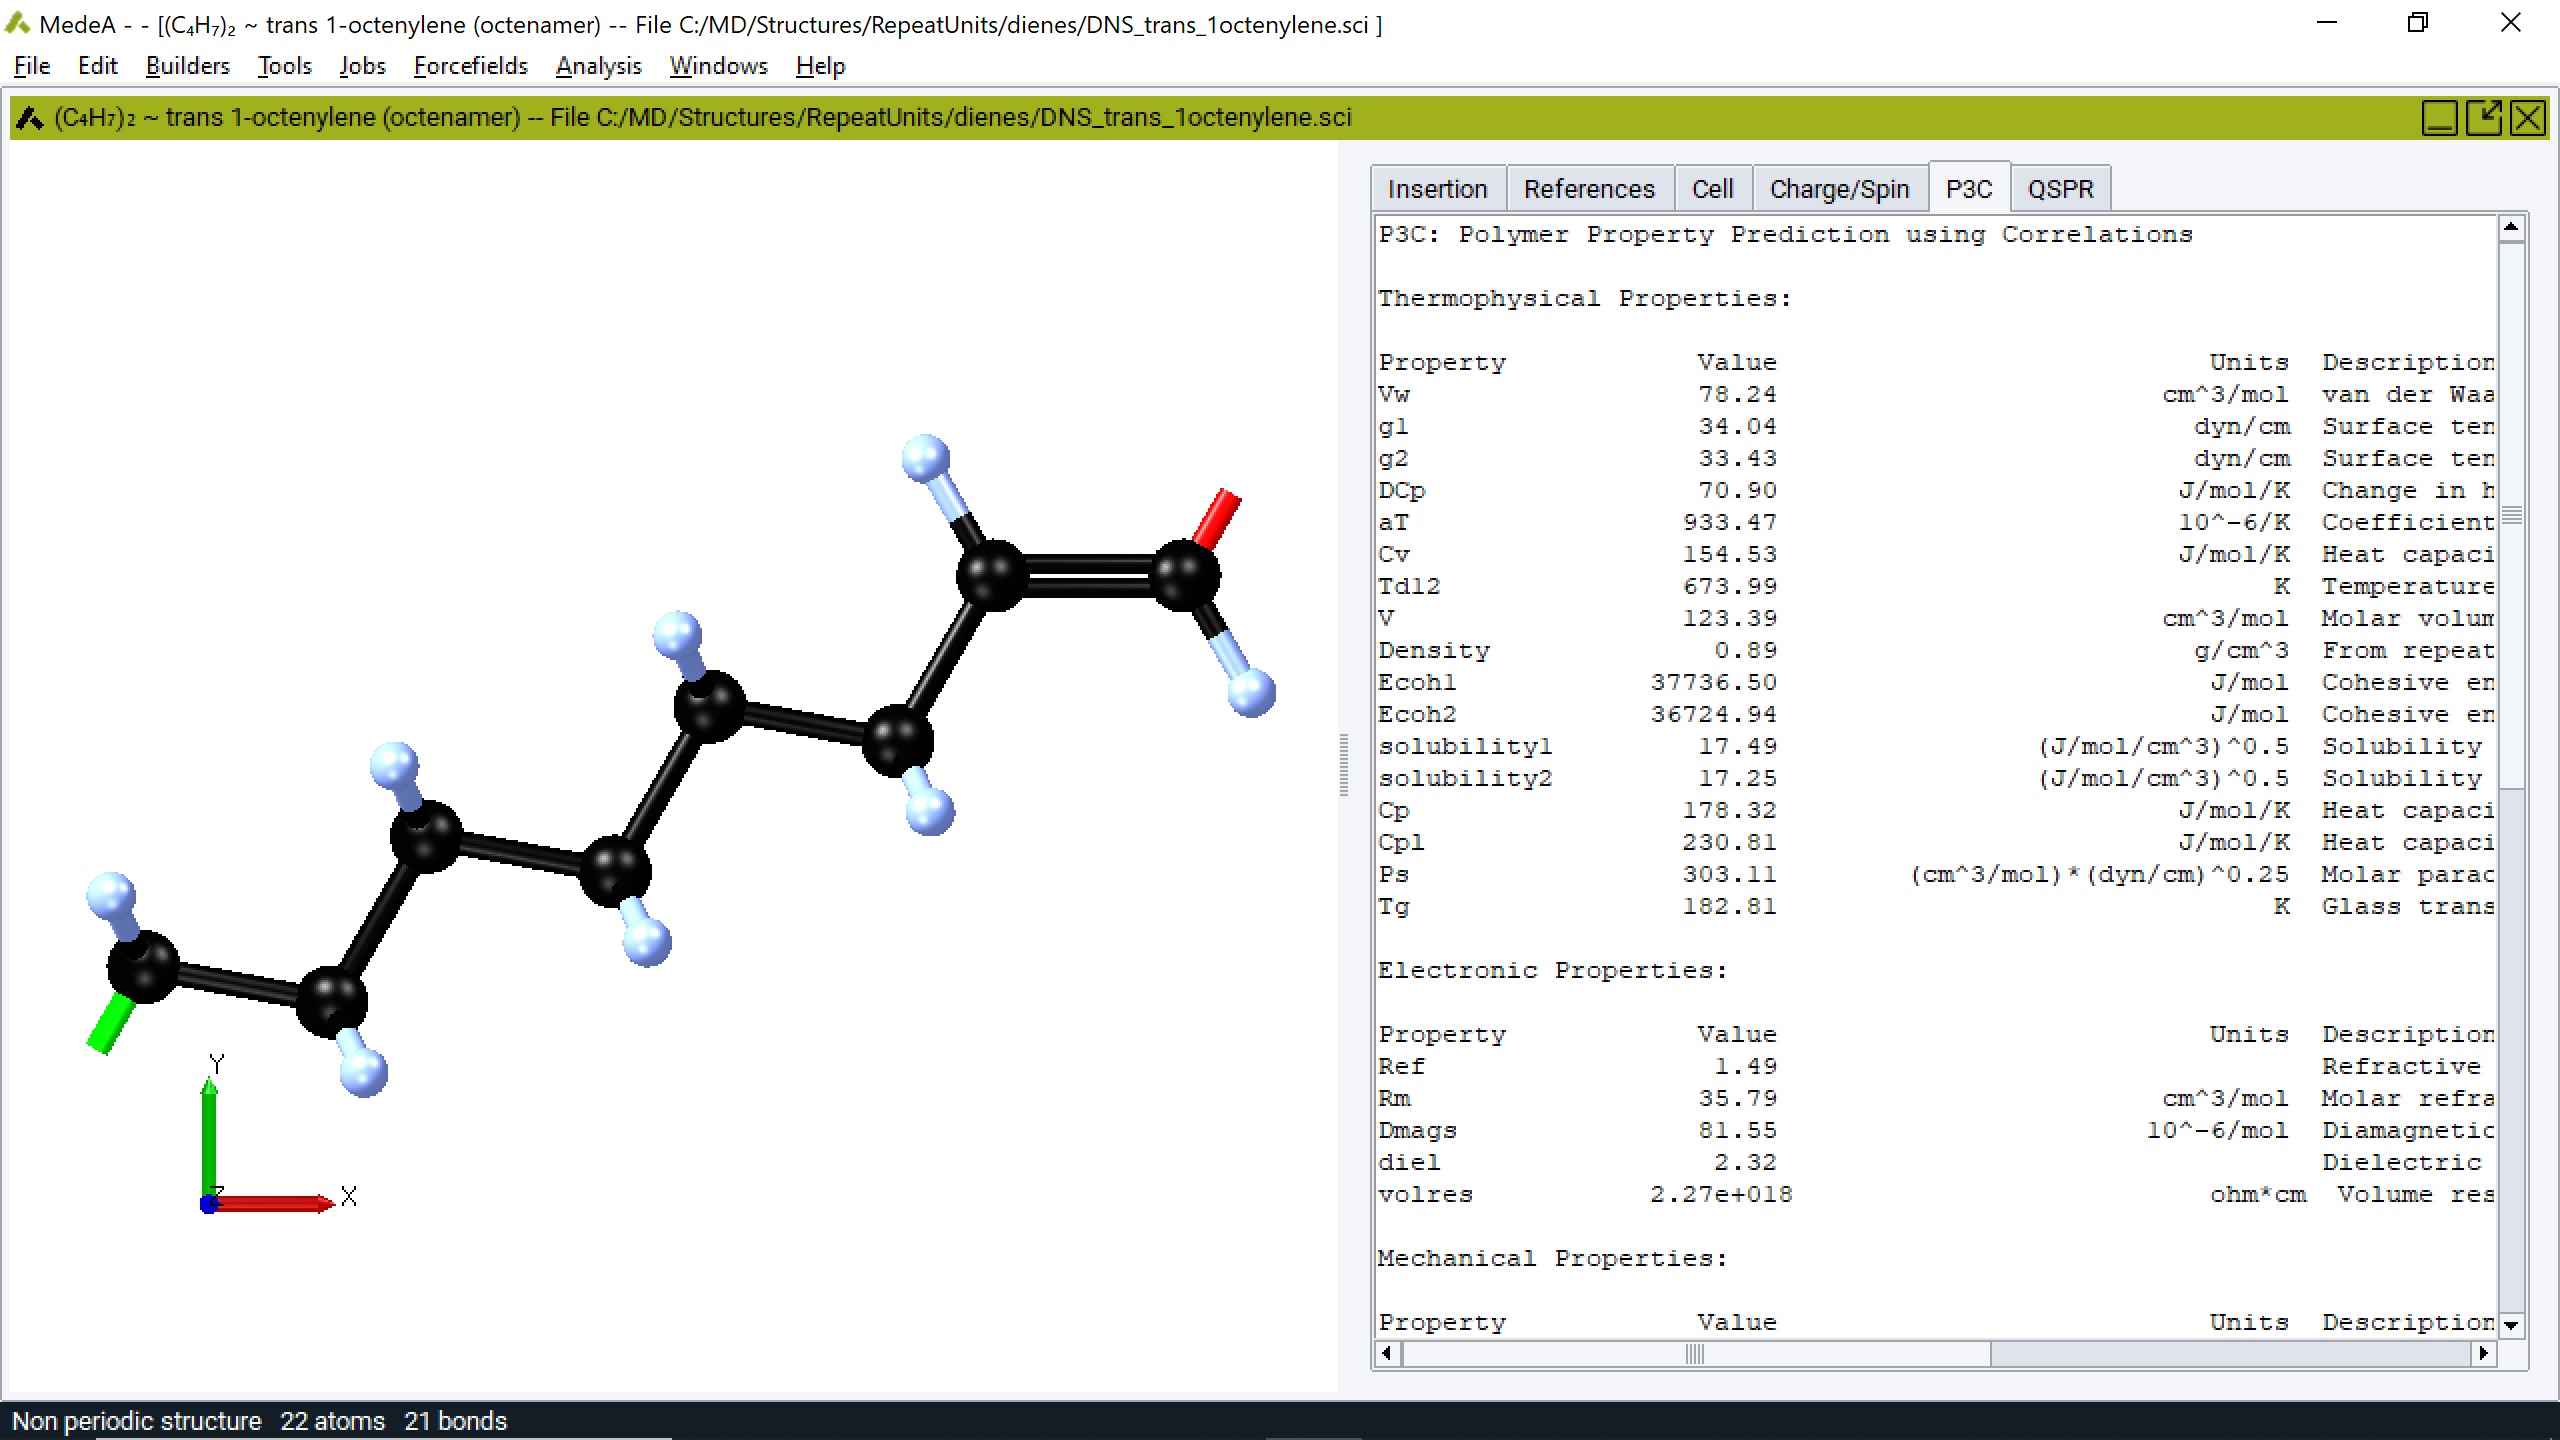
Click the P3C tab:
In MedeA Flowchart:
- Open the MedeA Flowchart via Job >> New Job…
- Add the P3C: Polymer Property Prediction using Correlations stage and click Run
- Results are printed in the Job.out file
Note
An advantage of running MedeA P3C in a flowchart is that you can employ P3C stage on each of the members of a structure list to perform high through-put polymer property prediction
Hint
Interactive MedeA P3C reports are limited to a maximum of 100 atoms. For systems larger than 100 atoms, you can compute P3C properties by clicking the Compute button at the bottom of the P3C report window. There is no limit on the number of atoms in a repeat unit in flowchart calculations.
2.35.5. Background
Empirical correlative property prediction methods play an important role in polymer research. A range of such methods have been described and are summarized in the literature [2]. The MedeA P3C Flowchart stage implements the scheme developed and described by Jozef Bicerano in Prediction of Polymer Properties [1].
In contrast to alternative empirical polymer property prediction schemes, which employ group-based correlations, Bicerano’s method is based on topological connectivity indices, originally developed by Kier and Hall [3], [4], [5], and employed in quantitative structure and activity relationship (QSAR) based analysis of pharmaceutically active compounds. Bicerano augmented correlations based on connectivity indices with correction terms relating to key features contained within constituent repeat units.
The strength of Bicerano’s approach is that the reliance on non-group based descriptors implies that predictions for polymers not part of the training set, composed of groups which have not yet been encountered, will generally be reliable.
2.35.6. Topological Indices
As discussed by Kier and Hall, flexible descriptors of molecular properties can be extracted from the hydrogen-suppressed connectivity graph of a given compound. Here, atoms represent the vertices in the connectivity graph, and bonds represent connecting edges between vertices. The resulting graph is then analyzed in terms of its topological properties.
Kier and Hall [3] developed connectivity indices which account for the topological properties of the graph and account for vertices, edges, and higher-order constructs within that graph. For example, a simple topological index, 0\({\chi}\), may be obtained by counting heavy atoms connected by a single edge to each vertex, and for the complete structure by forming the sum of the reciprocal of the square root of this count over all vertices. Summed in this way, a single real number, 0\({\chi}\), represents a measure of the level of heavy atom branching for any system. The more heavily branched a given repeat unit, the lower its 0\({\chi}\) index.
A similar vertex-level descriptor may be obtained by counting not nearest vertex neighbors but nearest neighbor valence electrons at each vertex. This descriptor, dubbed 0\({\chi}\)v, contains information relating to the bonding content of the system in a single descriptor.
This summation approach may be extended to include similar sums over edges (bonds), and as such sample heavy atom connectedness and valence electron counts. Such topological descriptors, called 1\({\chi}\) and 1\({\chi}\)v, succinctly represent information about the bonding and electronic character of repeat units.
Kier and Hall showed that the resulting topological indices provide valuable descriptors for a range of physical properties. Bicerano recognized that such descriptors provide a route to reliable predictions of properties for polymers with different chemistries, and Bicerano’s Prediction of Polymer Properties provides extensive details of the resulting prediction scheme for polymer systems developed at the Dow Chemical Company. Here repeat units are treated as being infinitely bonded through the connection of head and tail atoms, and the 0\({\chi}\), 0\({\chi}\)v, 1\({\chi}\), and 1\({\chi}\)v topological indices are computed for the resulting (essentially infinite) polymer system. Bicerano provides information on the correlation of these descriptors with empirical polymer property data, and augments the resulting correlations using counts of specific entities in repeat units.
The resulting set of correlations and descriptor types provides an extensive database of information which may be used to predict polymer properties.
Note
MedeA P3C employs the end-to-end length of the repeat unit in the calculation of several properties. For this reason, with systems of moderate complexity (where the length of the repeat unit is affected by its conformation, for example), it is recommended that you relax the structure of the repeat unit to a minimum energy configuration using either the PCFF+ forcefield and LAMMPS or MOPAC.
2.35.7. Designer Correlations
As discussed by Bicerano [6] in ‘Prediction of Polymer Properties’ (chapter 17), for certain categories of repeat units, it may be possible to develop improved correlations which do not attempt to be widely applicable and therefore can be highly tuned to specific systems. As MedeA P3C reports descriptors for all repeat units, designer correlations may be developed (for example employing an in-house property data and suitable regression software such as that provided by Microsoft’s Excel spreadsheet) and once such correlations have been established, they may be employed to generate property data for novel repeat units. To employ a designer correlation, check the Designer correlation checkbox, and enter the appropriate correlation, employing the descriptor name from the descriptor output section preceded by a dollar symbol. An illustrative designer correlation is provided as a default (this is described by Bicerano and results in improved Tg estimates for polymers containing phthalimide groups).
2.35.8. Output
When employed in a flowchart, MedeA P3C output begins with a listing of the descriptors obtained from the selected repeat unit. Many of these descriptors are counts of the chemical features encountered in the repeat unit in specific chemical environments, for example, the number of methyl groups attached to aromatic rings (which increase the rigidity of the polymer chain) or the number of hydroxyl groups (which increase the hydrophilicity of the polymer). Bicerano provides considerable detail on the computation of these descriptors. Additionally, the Kier and Hall \({\chi}\) parameters for the selected repeat unit are reported.
2.35.9. Properties
Properties based on the correlations developed by Bicerano are provided in the subsequent output sections. These are groups depending on property types such as thermophysical, electronic, mechanical, entanglement, and transport.
2.35.10. Additional Properties
In addition to the original Bicerano [1] property set, additional correlations have been implemented in P3C. These include oxygen and nitrogen diffusivities, based on the correlation described by Patel and coworkers [7] and direct implementation of Seitz’s method to compute Poisson’s ratio. [8]
2.35.11. Copolymer Properties
P3C can be used to evaluate the properties of random copolymers. The command to do this, P3C for copolymers is available on the Analysis menu of MedeA when the P3C license is present. When this command is selected, a dialog box is displayed that allows you to specify the fraction of each repeat unit in the random copolymer and properties are reported in the associated table when the Compute button is depressed.
| [1] | (1, 2, 3) Jozef Bicerano, Prediction of Polymer Properties, Third. (New York: Marcel Dekker, Inc., 2002). |
| [2] | Dirk Willem Van Krevelen and Klaas Te Nijenhuis, Properties of Polymers: Their Correlation with Chemical Structure; Their Numerical Estimation and Prediction From Additive Group Contributions, Fourth. (Amsterdam: Elsevier, 2009). |
| [3] | (1, 2) Lemont B Kier and Lowell H Hall, “The Nature of Structure Activity Relationships and Their Relation to Molecular Connectivity,” European Journal of Medicinal Chemistry 12 (1977): 307. |
| [4] | Lemont B Kier and Lowell H Hall, “Derivation and Significance of Valence Molecular Connectivity,” Journal of Pharmaceutical Sciences 70, no. 6 (June 1981): 583-589. |
| [5] | L B Kier and Lowell H Hall, Molecular Connectivity in Structure-Activity Analysis, (Chichester: Research Studies Press, 1986). |
| [6] | Jozef Bicerano, Prediction of Polymer Properties, Third. (New York: Marcel Dekker, Inc., 2002). |
| [7] | Hitesh C Patel, John S Tokarski, and A J Hopfinger, “Molecular Modeling of Polymers 16. Gaseous Diffusion in Polymers: a Quantitative Structure-Property Relationship (QSPR) Analysis,” Pharmaceutical Research 14, no. 10 (1997): 1349-1354. |
| [8] | J T Seitz, “The Estimation of Mechanical Properties of Polymers From Molecular Structure,” Journal of Applied Polymer Science 49, no. 8 (August 20, 1993): 1331-1351. |
| download: | pdf |
|---|